Adding tracing to your GraphQL services with Jaeger
Tracing has emerged as one of the most widely-used techniques to monitor the performance and health of your
services and applications, from development to production. Due to this heavy usage, a large amount of tooling
is published and improved constantly, focusing on features related to distributed systems and recent industry trends
like containerization. The following guide focuses on the basics of tracing and integrates tracing to a minimal setup
based on a Node.js GraphQL web service.
What exactly is tracing, and what is it used for?
Imagine you're operating a platform to order food online, let's say 🍕Pizza.
Your users can place orders by selecting a nearby restaurant and their toppings of choice, that's it for the product.
Aside from all validation and accounting logic, your web endpoint will interact with additional services like databases,
messaging queues, business analytics, and so on.
To fully grasp performance-related metrics and stats of specific system components in a more
extensive way than going through measures of memory consumption or used processing power,
you'd have to find a way to record the lifecycle of a user interaction, including processes invoked by the system itself, right?
That's exactly where tracing comes in: In our model, every user request would start a so-called span, the basic unit
for a trace, which is used to measure specific system details in a time range from the span's creation to its end.
Subsequent actions can be wrapped in (child) spans as well, creating a collection of spans for each request and action taken.
As I've mentioned above, requests to external services can (and should) be traced as well.
This can be achieved by a technique called propagation, in which actions and requests are grouped by a set context,
for example by passing a specific header to the requested service, which uses this to connect its created spans to the existing span.
Once recorded, the traces can be collected and exported to external services to aggregate and consume them later on,
this process is mostly handled by your tooling of choice, which I'll elaborate on in the following part.
If you want to continue reading about tracing concepts and get more interesting details,
I'd heavily recommend Google's famous Dapper paper,
outlining their custom-built architecture around distributed-systems tracing.
You will see people and projects referring to this publication in pretty much every resource about tracing systems,
making it one of the fundamentals to getting into it!
What options are out there?
As I've already mentioned in the beginning, there are various tools, supported by many popular vendors, going strong right now.
Most of the following tools are designed for the same use cases, following the same standards,
so they can often be replaced by similar tooling, without the need to massively refactor your code:
- OpenTracing: As a member project of the CNCF,
OpenTracing is the industry standard for any modern distributed tracing system, based on a
specification adopted by many tools out there - OpenZipkin: Based on the Dapper paper, Zipkin is another distributed tracing system,
written in Java, and one of the most used tracing tools - Jaeger: A highly-scalable tracing system natively supporting the OpenTracing
standard and offering features like a convenient web interface, as well as backward compatibility by exposing a
Zipkin-compatible endpoint - OpenCensus: A distribution of libraries to collect metrics and distributed
traces, created by Google and supported by vendors like Microsoft and some CNCF projects
For the following examples, we'll be using OpenCensus client libraries with the provided Jaeger exporter,
which gets us all the features we need to get up and running really fast!
How do I add tracing to my service?
For our example, we'll be extending a minimal service, used to place and retrieve orders, with some
tracing logic. As the service won't use a database or external resource for this guide,
I'll get into distributed tracing and trace propagation in a future post, so stay tuned for that!
First of all, let's start by adding Jaeger to your project. In the following example, we'll
be using a simple docker-compose setup to get the job done, although you'd probably deploy your app
to a Kubernetes cluster or another production system.
A full example of the code below can be found here.
For the initial Jaeger service configuration, we will be using the
recommended jaegertracing:all-in-one image,
since it is the easiest way to get up and running quickly. A description of all exposed ports can be found in the Jaeger docs,
you will mostly use :16686 to access the web ui.
version: '3.7'
services:
  ...
  tracing:
    image: jaegertracing:all-in-one:1.8.2
    ports:
      - '5775:5775'
      - '5778:5778'
      - '6831:6831'
      - '6832:6832'
      - '16686:16686'
      - '14268:14268'
      - '9411:9411'
    environment:
      COLLECTOR_ZIPKIN_PORT: '9411'
Continuing with the actual application, a GraphQL-based web service handling incoming orders, first of all, we'll
add the required tracing dependencies for OpenCensus:
When using TypeScript, you might need to add typings for mocha, since they are required by OpenCensus
# using yarn
yarn add @opencensus/nodejs \
         @opencensus/core \
         @opencensus/exporter-jaeger

# using npm
npm i @opencensus/nodejs \
      @opencensus/core \
      @opencensus/exporter-jaeger
If the package install fails due to a grpc build error, I'd recommend to add something like a yarn resolution to bump up your grpc version, because tooling like OpenCensus might use an outdated version
Now, we can start to add the basic integrations to our service, starting with the actual tracer object,
which will be used to create root and child spans for every incoming request.
import tracing from '@opencensus/nodejs';
import { JaegerTraceExporter } from '@opencensus/exporter-jaeger';

...

// Create tracer instance and set basic options
const tracer = tracing.start({
  logLevel: enableTracing ? 2 : 0,
  samplingRate: 1
}).tracer;

// Add Jaeger exporter if tracing is enabled
if (enableTracing) {
  tracer.registerSpanEventListener(
    // the 'host' option below refers
    // to the Jaeger service name defined
    // in your compose file
    new JaegerTraceExporter({
      host: 'tracing',
      serviceName: 'order-service'
    })
  );
}
Simple as that! If we've got tracing enabled (determined by the ENABLE_TRACING environment variable),
a tracer instance is created and connected to Jaeger using the OpenCensus exporter.
But there's still no logic to trace our service requests, so let's continue with that!
As with many things in GraphQL, there's plenty of ways and possibilities to integrate tracing into your projects,
but I've decided to add two middlewares based on the awesome graphql-middleware library,
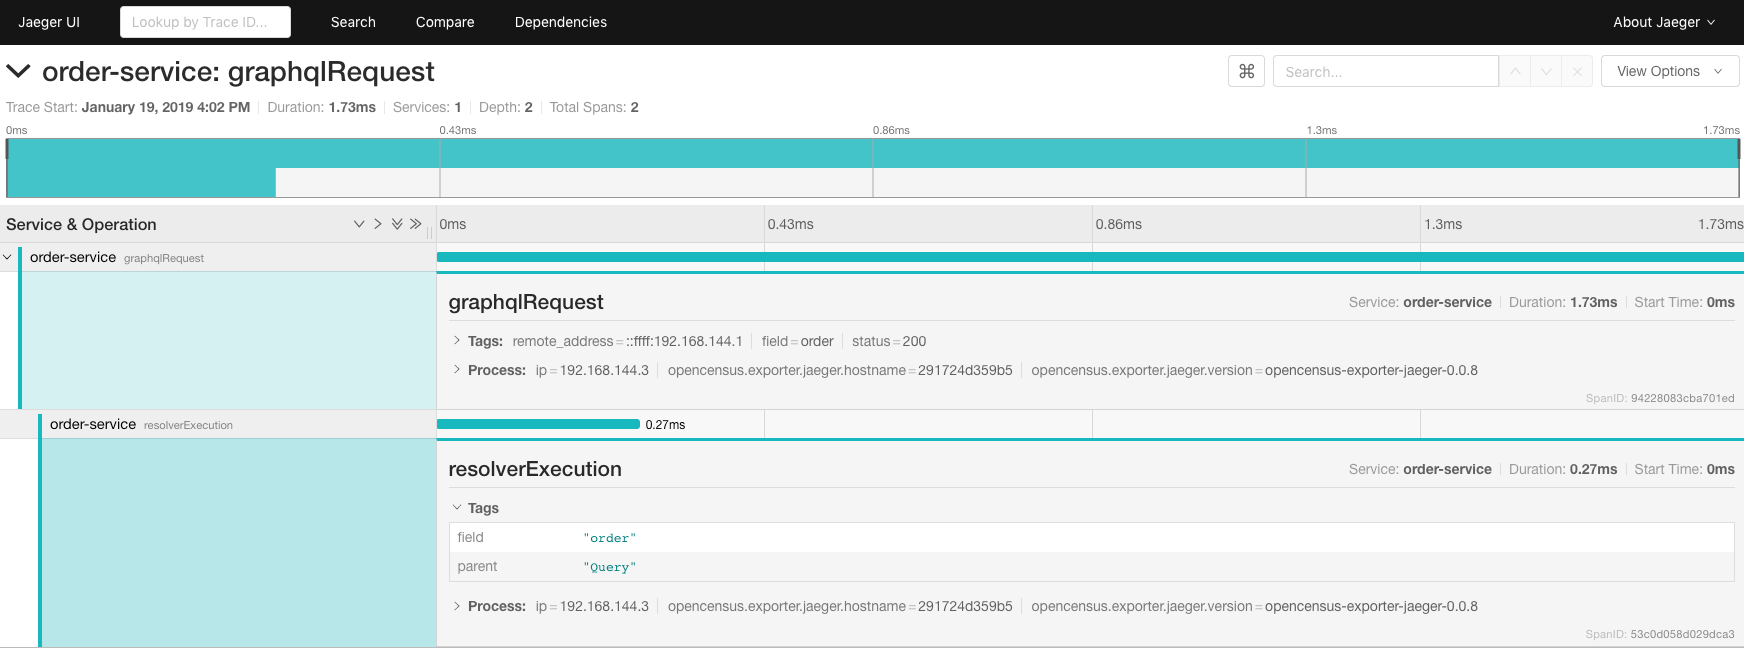
for adding a root trace for the request and a trace for each resolver.
This way, we'll have a top-level span with all basic request information (remote address, status, etc.) and a child span
for each executed resolver. Of course, this could be customized even more, to create spans for each validation, method call,
and whatever else you can think of!
const tracingMiddleware: IMiddlewareResolver = async (
  resolve,
  parent,
  args,
  context: IContext,
  info
) => {
  // Resolve request directly, if tracing is disabled
  if (!enableTracing) {
    return resolve(parent, args, context, info);
  }

  const { req: request, res: response } = context;

  return new Promise((res, rej) => {
    // Create root span for request
    tracer.startRootSpan({ name: 'graphqlRequest' }, async span => {
      // Add some basic request information
      span.addAttribute('remote_address', request.ip);
      span.addAttribute('field', info.fieldName);

      // Register handler to end span once request is done
      response.on('finish', () => {
        span.addAttribute('status', response.statusCode);
        span.end();
      });

      // Add root span to context
      context.rootSpan = span;

      // Resolve request and return data, or add error details to span and throw
      try {
        const data = await resolve(parent, args, context, info);
        res(data);
      } catch (err) {
        span.addAnnotation(
          `${err.fieldName || ''} resolver threw an error`,
          err
        );
        rej(err);
      }
    });
  });
};

const resolverTracingMiddleware: IMiddlewareResolver = async (
  resolve,
  parent,
  args,
  context: IContext,
  info
) => {
  const { rootSpan } = context;

  // Resolve directly, if tracing is disabled or not started
  if (!enableTracing || !rootSpan) {
    return resolve(parent, args, context, info);
  }

  // Create child span and add resolver-related data
  const resolverSpan = tracer.startChildSpan('resolverExecution');
  resolverSpan.addAttribute('field', info.fieldName);
  resolverSpan.addAttribute('parent', info.parentType.name);
  resolverSpan.start();

  // Resolve request and return, or throw error (handled by tracingMiddleware)
  try {
    const data = await resolve(parent, args, context, info);
    resolverSpan.end();
    return data;
  } catch (err) {
    resolverSpan.addAnnotation('an error was thrown', err);
    resolverSpan.end();

    err.fieldName = info.fieldName;
    throw err;
  }
};
Now, that we have created the middleware resolvers, we need to wrap them around our schema.
Since I'd just like to demonstrate the tracing, we only use these two middlewares.
const withTracingMiddleware: IMiddleware = {
  Query: tracingMiddleware,
  Mutation: tracingMiddleware
};

// To allow for the repeated use of the resolver tracing
// middleware, I'd recommend adding the resolver to every
// resolvable field in the schema, otherwise the middleware
// might not be executed in some cases
const withResolverTracingMiddleware: IMiddleware = {
  Query: {
    orders: resolverTracingMiddleware,
    order: resolverTracingMiddleware
  },
  Mutation: {
    placeOrder: resolverTracingMiddleware
  }
};

...

// Construct schema and apply tracing middleware
const schema = applyMiddleware(
  makeExecutableSchema({ typeDefs, resolvers }),
  withTracingMiddleware,
  withResolverTracingMiddleware
);
And that's about it! We've created two GraphQL middleware resolvers and applied them to our schema!
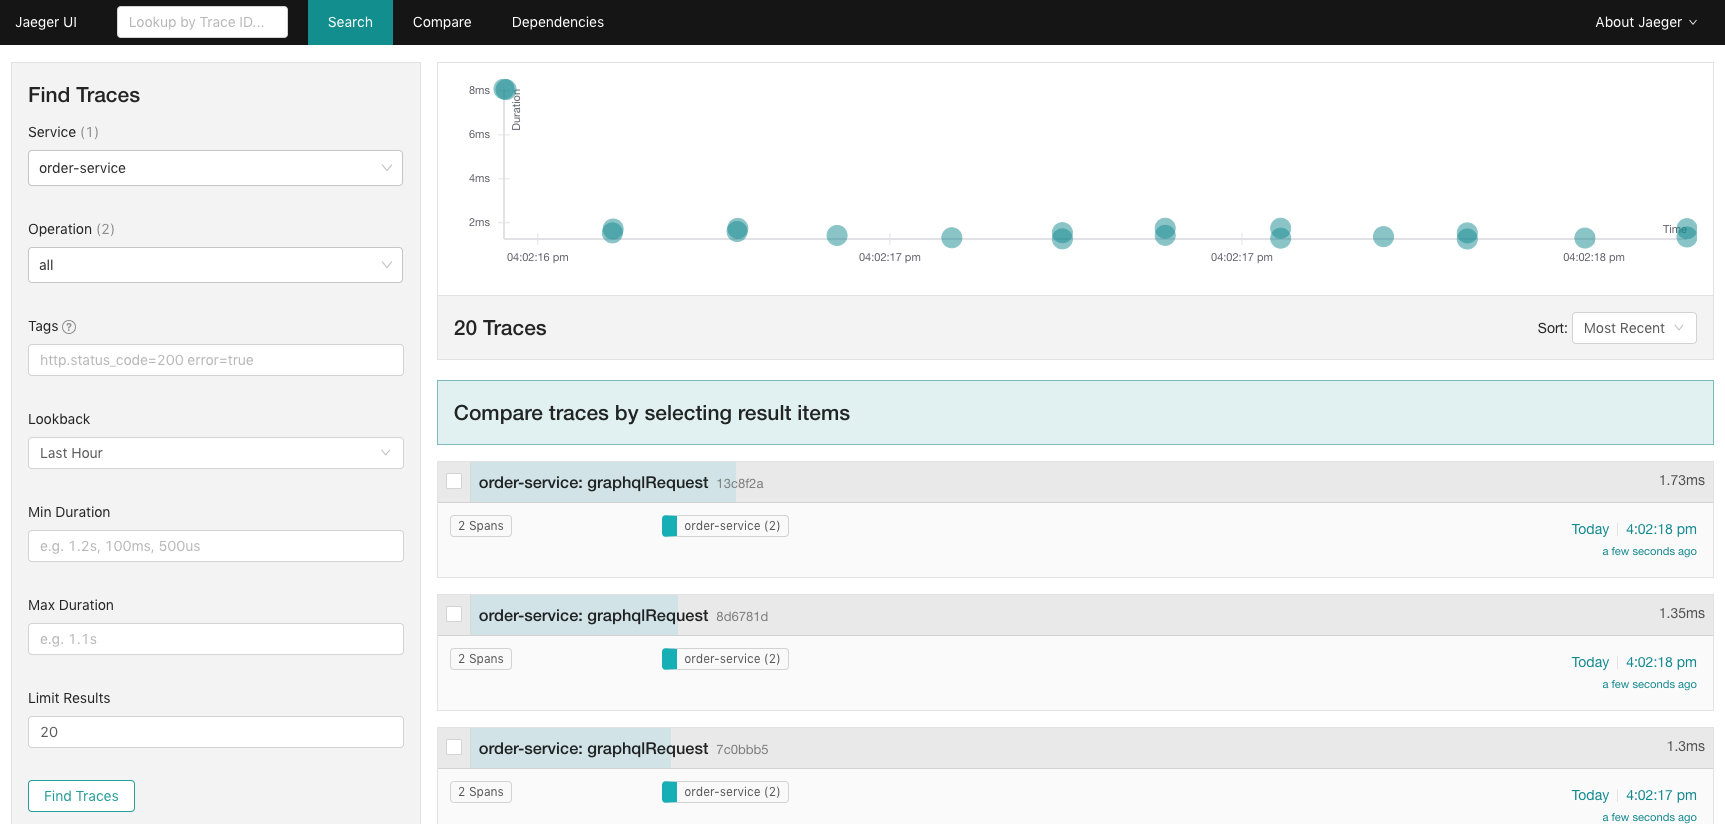
If we build and fire up our compose setup, we can see the Jaeger service starting up, as well as our order service.
After sending some requests to the service, you can open up the Jaeger Web UI and look at the recorded spans,
which should look similar to the images below!


And that's pretty much it for the basics 🎉! As I've already mentioned, you can go on and add tracing to more parts of your
application to gain extensive insights into its performance!
Thanks a lot for reading my first real guide! If you've got any questions, want to comment on something or found a bug,
don't hesitate to send a mail 👍